mirror of
https://github.com/kyverno/policy-reporter.git
synced 2024-12-14 11:57:32 +00:00
139 lines
5.9 KiB
Markdown
139 lines
5.9 KiB
Markdown
# Policy Reporter
|
|
[](https://github.com/fjogeleit/policy-reporter/actions/workflows/ci.yaml) [](https://goreportcard.com/report/github.com/fjogeleit/policy-reporter) [](https://coveralls.io/github/fjogeleit/policy-reporter?branch=main)
|
|
|
|
## Motivation
|
|
|
|
Kyverno ships with two types of validation. You can either enforce a rule or audit it. If you don't want to block developers or if you want to try out a new rule, you can use the audit functionality. The audit configuration creates [PolicyReports](https://kyverno.io/docs/policy-reports/) which you can access with `kubectl`. Because I can't find a simple solution to get a general overview of this PolicyReports and PolicyReportResults, I created this tool to send information about PolicyReports to different targets like [Grafana Loki](https://grafana.com/oss/loki/), [Elasticsearch](https://www.elastic.co/de/elasticsearch/) or [Slack](https://slack.com/).
|
|
|
|
Policy Reporter provides also a Prometheus Metrics API as well as an standalone mode along with the [Policy Reporter UI](#policy-report-ui).
|
|
|
|
This project is in an early stage. Please let me know if anything did not work as expected or if you want to send your audits to unsupported targets.
|
|
|
|
## Documentation
|
|
|
|
You can find detailed Information about Features and Configurations in the [Documentation](https://github.com/fjogeleit/policy-reporter/wiki).
|
|
|
|
## Getting Started
|
|
* [Installation with Helm v3](#installation-with-helm-v3)
|
|
* [Policy Reporter UI](#policy-reporter-ui)
|
|
* [Targets](#targets)
|
|
* [Monitoring](#monitoring)
|
|
|
|
## Installation with Helm v3
|
|
|
|
Installation via Helm Repository
|
|
|
|
### Add the Helm repository
|
|
|
|
```bash
|
|
helm repo add policy-reporter https://fjogeleit.github.io/policy-reporter
|
|
helm repo update
|
|
```
|
|
|
|
### Basic Installation - Provides Prometheus Metrics
|
|
|
|
```bash
|
|
helm install policy-reporter policy-reporter/policy-reporter -n policy-reporter --create-namespace
|
|
```
|
|
|
|
### Example
|
|
|
|

|
|
|
|
## Policy Reporter UI
|
|
|
|
You can use the Policy Reporter as standalone Application along with the [Policy Reporter UI](https://github.com/fjogeleit/policy-reporter-ui).
|
|
|
|
The UI is provided as optional Helm Sub Chart and can be enabled by setting `ui.enabled` to `true`.
|
|
|
|
### Installation
|
|
|
|
```bash
|
|
helm install policy-reporter policy-reporter/policy-reporter --set ui.enabled=true -n policy-reporter --create-namespace
|
|
```
|
|
|
|
### Access it with Port Forward on localhost
|
|
|
|
```bash
|
|
kubectl port-forward service/policy-reporter-ui 8082:8080 -n policy-reporter
|
|
```
|
|
|
|
Open `http://localhost:8082/` in your browser.
|
|
|
|
### Example
|
|
|
|
The UI is an optional application and provides three different views with informations about the validation status of your audit policies.
|
|
|
|
<kbd>
|
|
<img src="https://github.com/fjogeleit/policy-reporter-ui/blob/main/docs/images/dashboard.png?raw=true" alt="Policy Reporter UI - Dashboard">
|
|
</kbd>
|
|
<br><br>
|
|
<kbd>
|
|
<img src="https://github.com/fjogeleit/policy-reporter-ui/blob/main/docs/images/policy-report.png?raw=true" alt="Policy Reporter UI - PolicyReport Details">
|
|
</kbd>
|
|
<br><br>
|
|
<kbd>
|
|
<img src="https://github.com/fjogeleit/policy-reporter-ui/blob/main/docs/images/cluster-policy-report.png?raw=true" alt="Policy Reporter UI - ClusterPolicyReport Details">
|
|
</kbd>
|
|
<br><br>
|
|
|
|
## Targets
|
|
|
|
Policy Reporter supports the following Targets to send new (Cluster)PolicyReport Results too:
|
|
* [Grafana Loki](https://github.com/fjogeleit/policy-reporter/wiki/grafana-loki)
|
|
* [Elasticsearch](https://github.com/fjogeleit/policy-reporter/wiki/elasticsearch)
|
|
* [Slack](https://github.com/fjogeleit/policy-reporter/wiki/slack)
|
|
* [Discord](https://github.com/fjogeleit/policy-reporter/wiki/discord)
|
|
* [MS Teams](https://github.com/fjogeleit/policy-reporter/wiki/ms-teams)
|
|
|
|
Use the documentation for details about the usage and configuration of each target.
|
|
|
|
### Screenshots
|
|
|
|
#### Loki
|
|
<kbd>
|
|
<img src="https://github.com/fjogeleit/policy-reporter/blob/main/docs/images/grafana-loki.png?raw=true" alt="Grafana Loki">
|
|
</kbd>
|
|
<br><br>
|
|
|
|
#### Elasticsearch
|
|
<kbd>
|
|
<img src="https://github.com/fjogeleit/policy-reporter/blob/main/docs/images/elasticsearch.png?raw=true" alt="Elasticsearch">
|
|
</kbd>
|
|
<br><br>
|
|
|
|
#### Slack
|
|
<kbd>
|
|
<img src="https://github.com/fjogeleit/policy-reporter/blob/main/docs/images/slack.png?raw=true" alt="Slack">
|
|
</kbd>
|
|
<br><br>
|
|
|
|
#### Discord
|
|
<kbd>
|
|
<img src="https://github.com/fjogeleit/policy-reporter/blob/main/docs/images/discord.png?raw=true" alt="Discord">
|
|
</kbd>
|
|
<br><br>
|
|
|
|
#### MS Teams
|
|
<kbd>
|
|
<img src="https://github.com/fjogeleit/policy-reporter/blob/main/docs/images/ms-teams.png?raw=true" alt="MS Teams">
|
|
</kbd>
|
|
<br><br>
|
|
|
|
## Monitoring
|
|
|
|
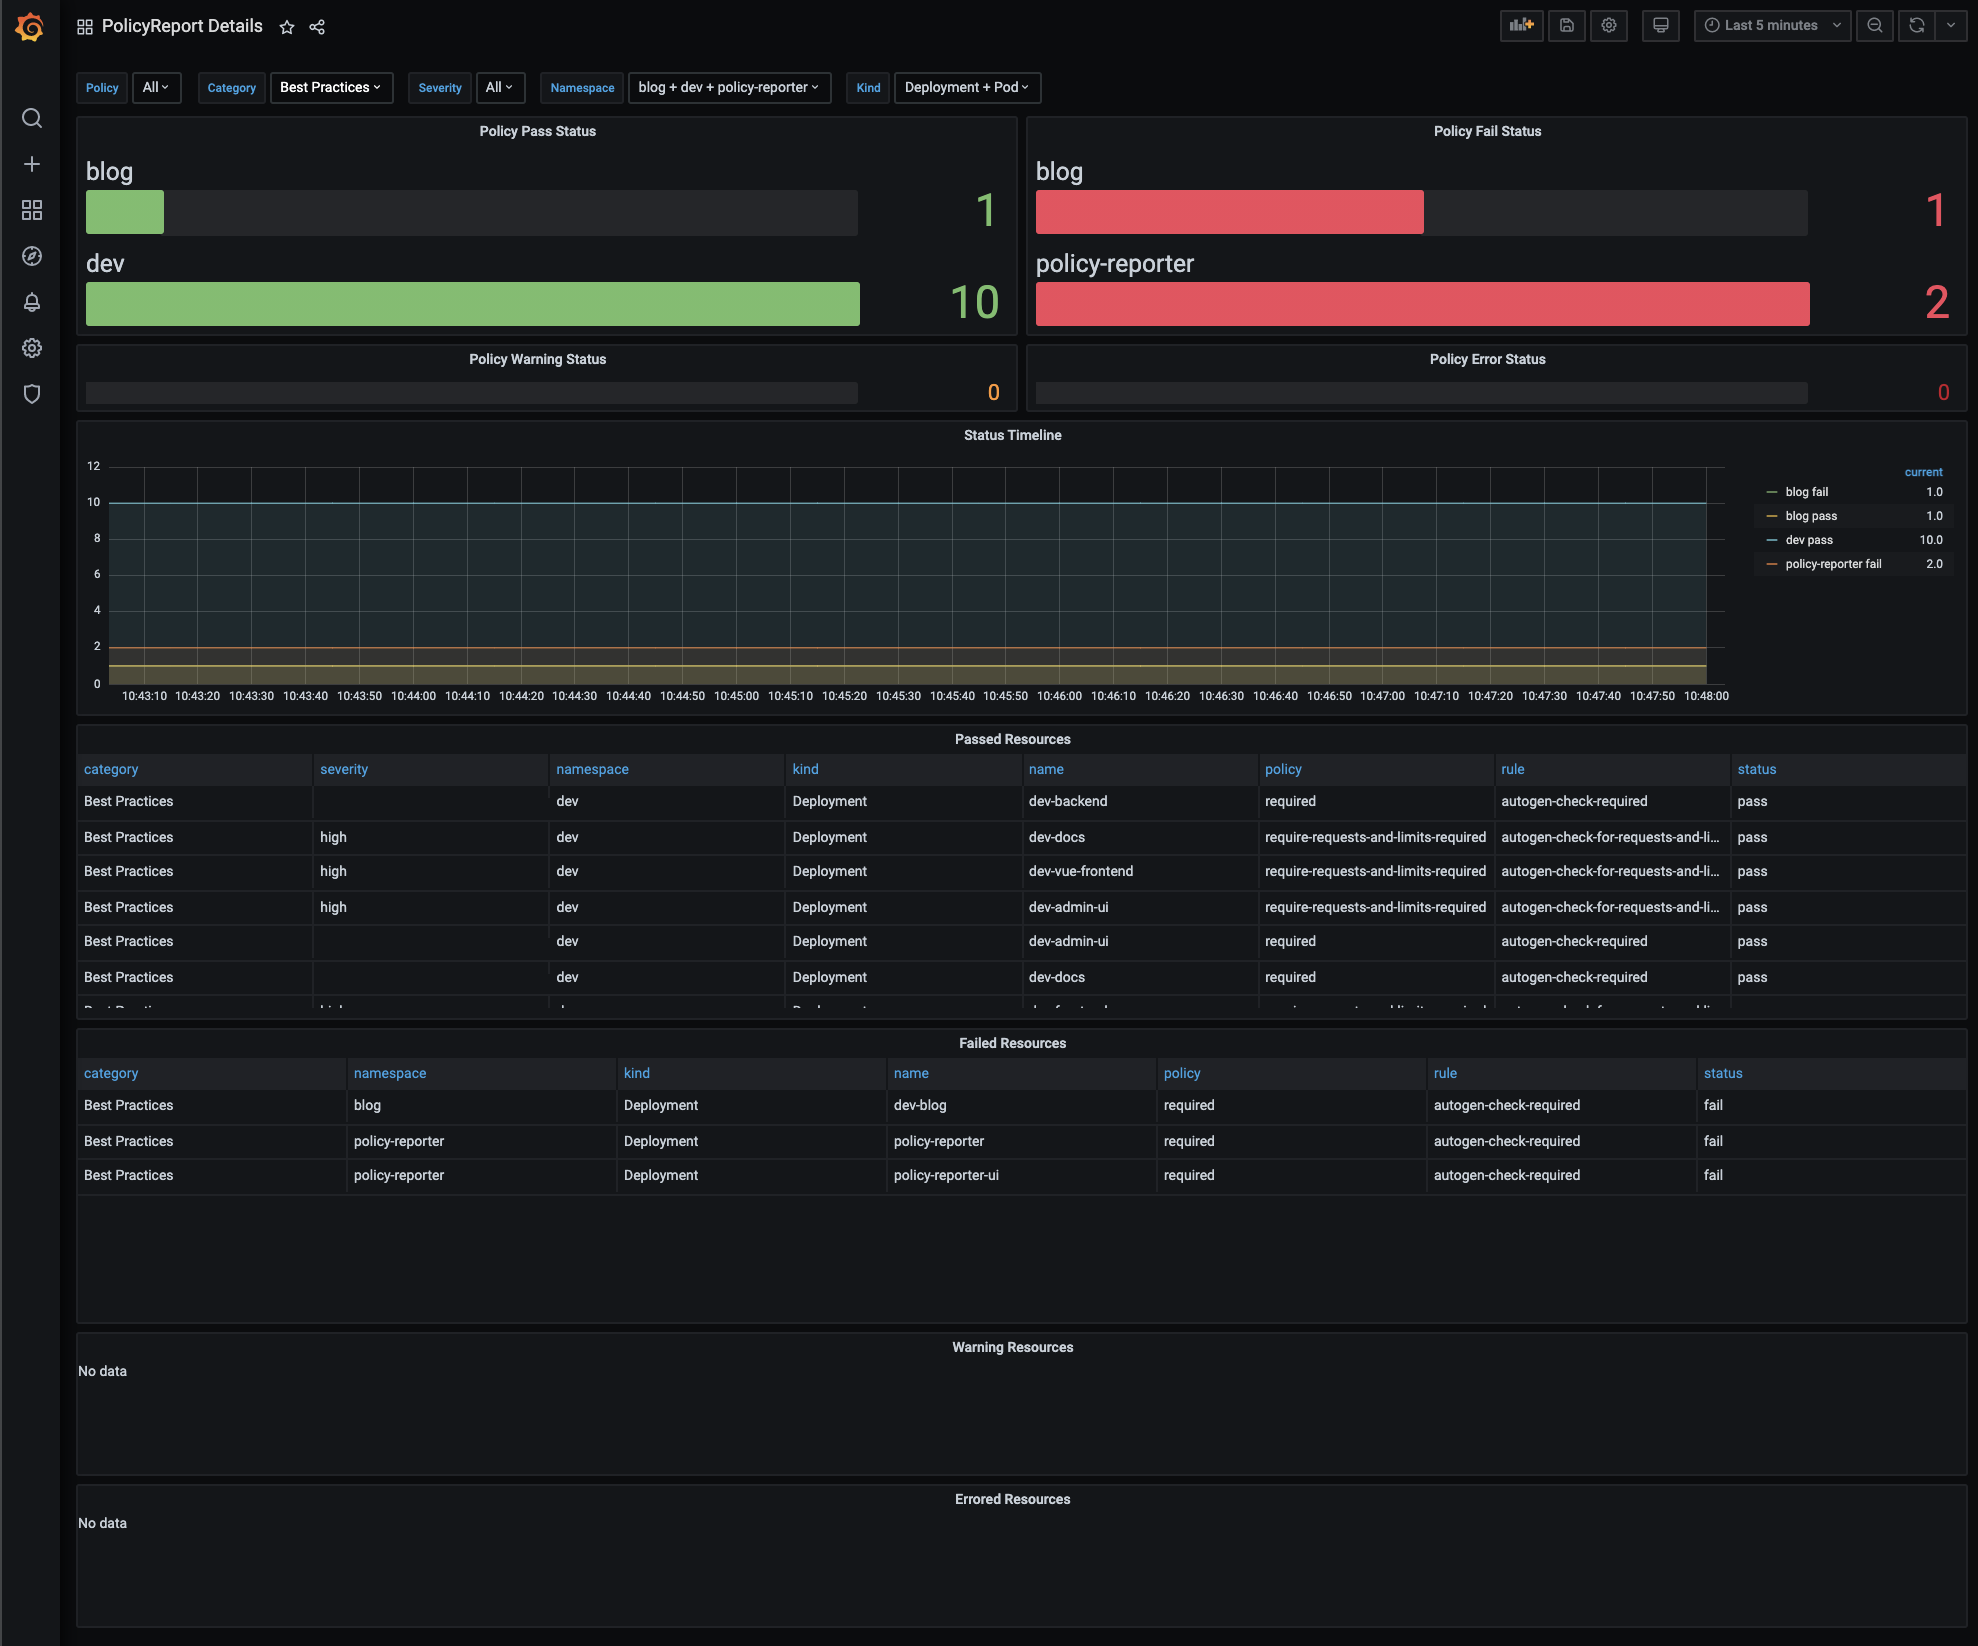
The Helm Chart includes optional Sub Chart for [Prometheus Operator](https://github.com/prometheus-community/helm-charts/tree/main/charts/kube-prometheus-stack) Integration. The provided Dashboards working without Loki and are only based on the Prometheus Metrics.
|
|
|
|
Have a look into the [Documentation](https://github.com/fjogeleit/policy-reporter/wiki/prometheus-operator-integration) for details.
|
|
|
|
### Grafana Dashboard Import
|
|
|
|
If you are not using the MonitoringStack you can import the dashboards from [Grafana](https://grafana.com/orgs/policyreporter/dashboards)
|
|
|
|
### Dashboard Preview
|
|
|
|

|
|
|
|

|
|
|
|

|