5.9 KiB
Policy Reporter
Motivation
Kyverno ships with two types of validation. You can either enforce a rule or audit it. If you don't want to block developers or if you want to try out a new rule, you can use the audit functionality. The audit configuration creates PolicyReports which you can access with kubectl. Because I can't find a simple solution to get a general overview of this PolicyReports and PolicyReportResults, I created this tool to send information about PolicyReports to different targets like Grafana Loki, Elasticsearch or Slack.
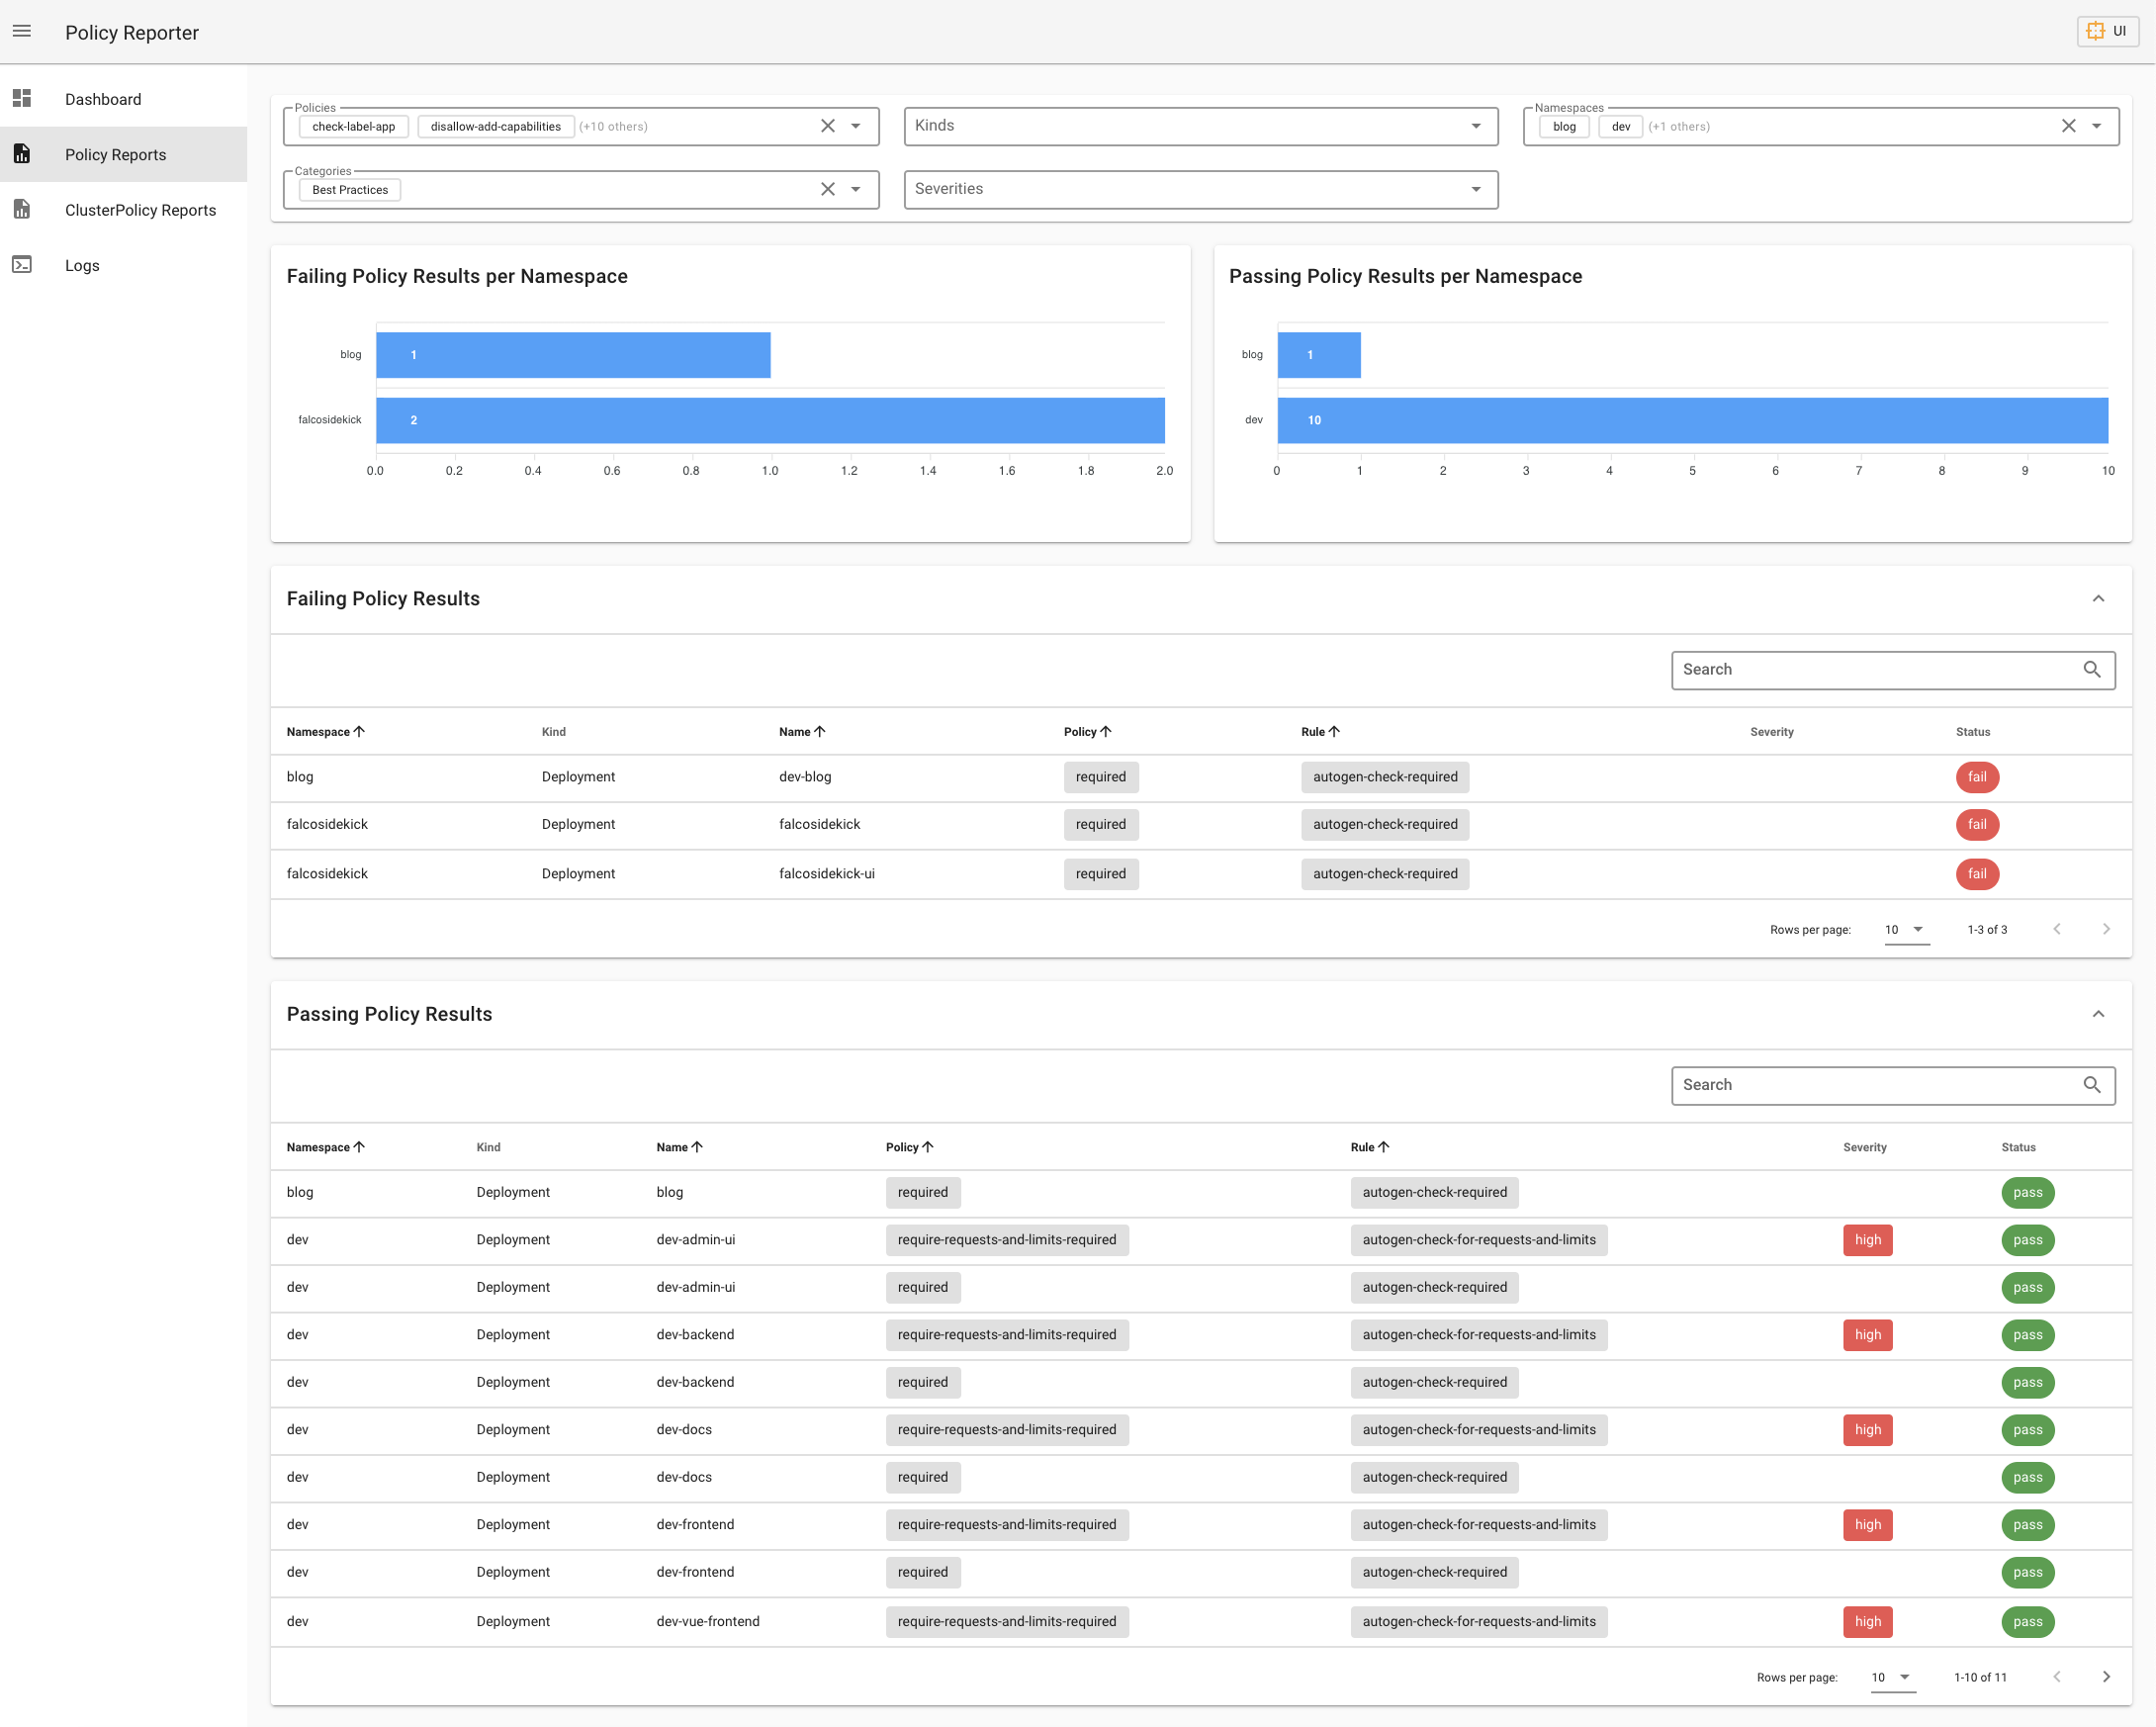
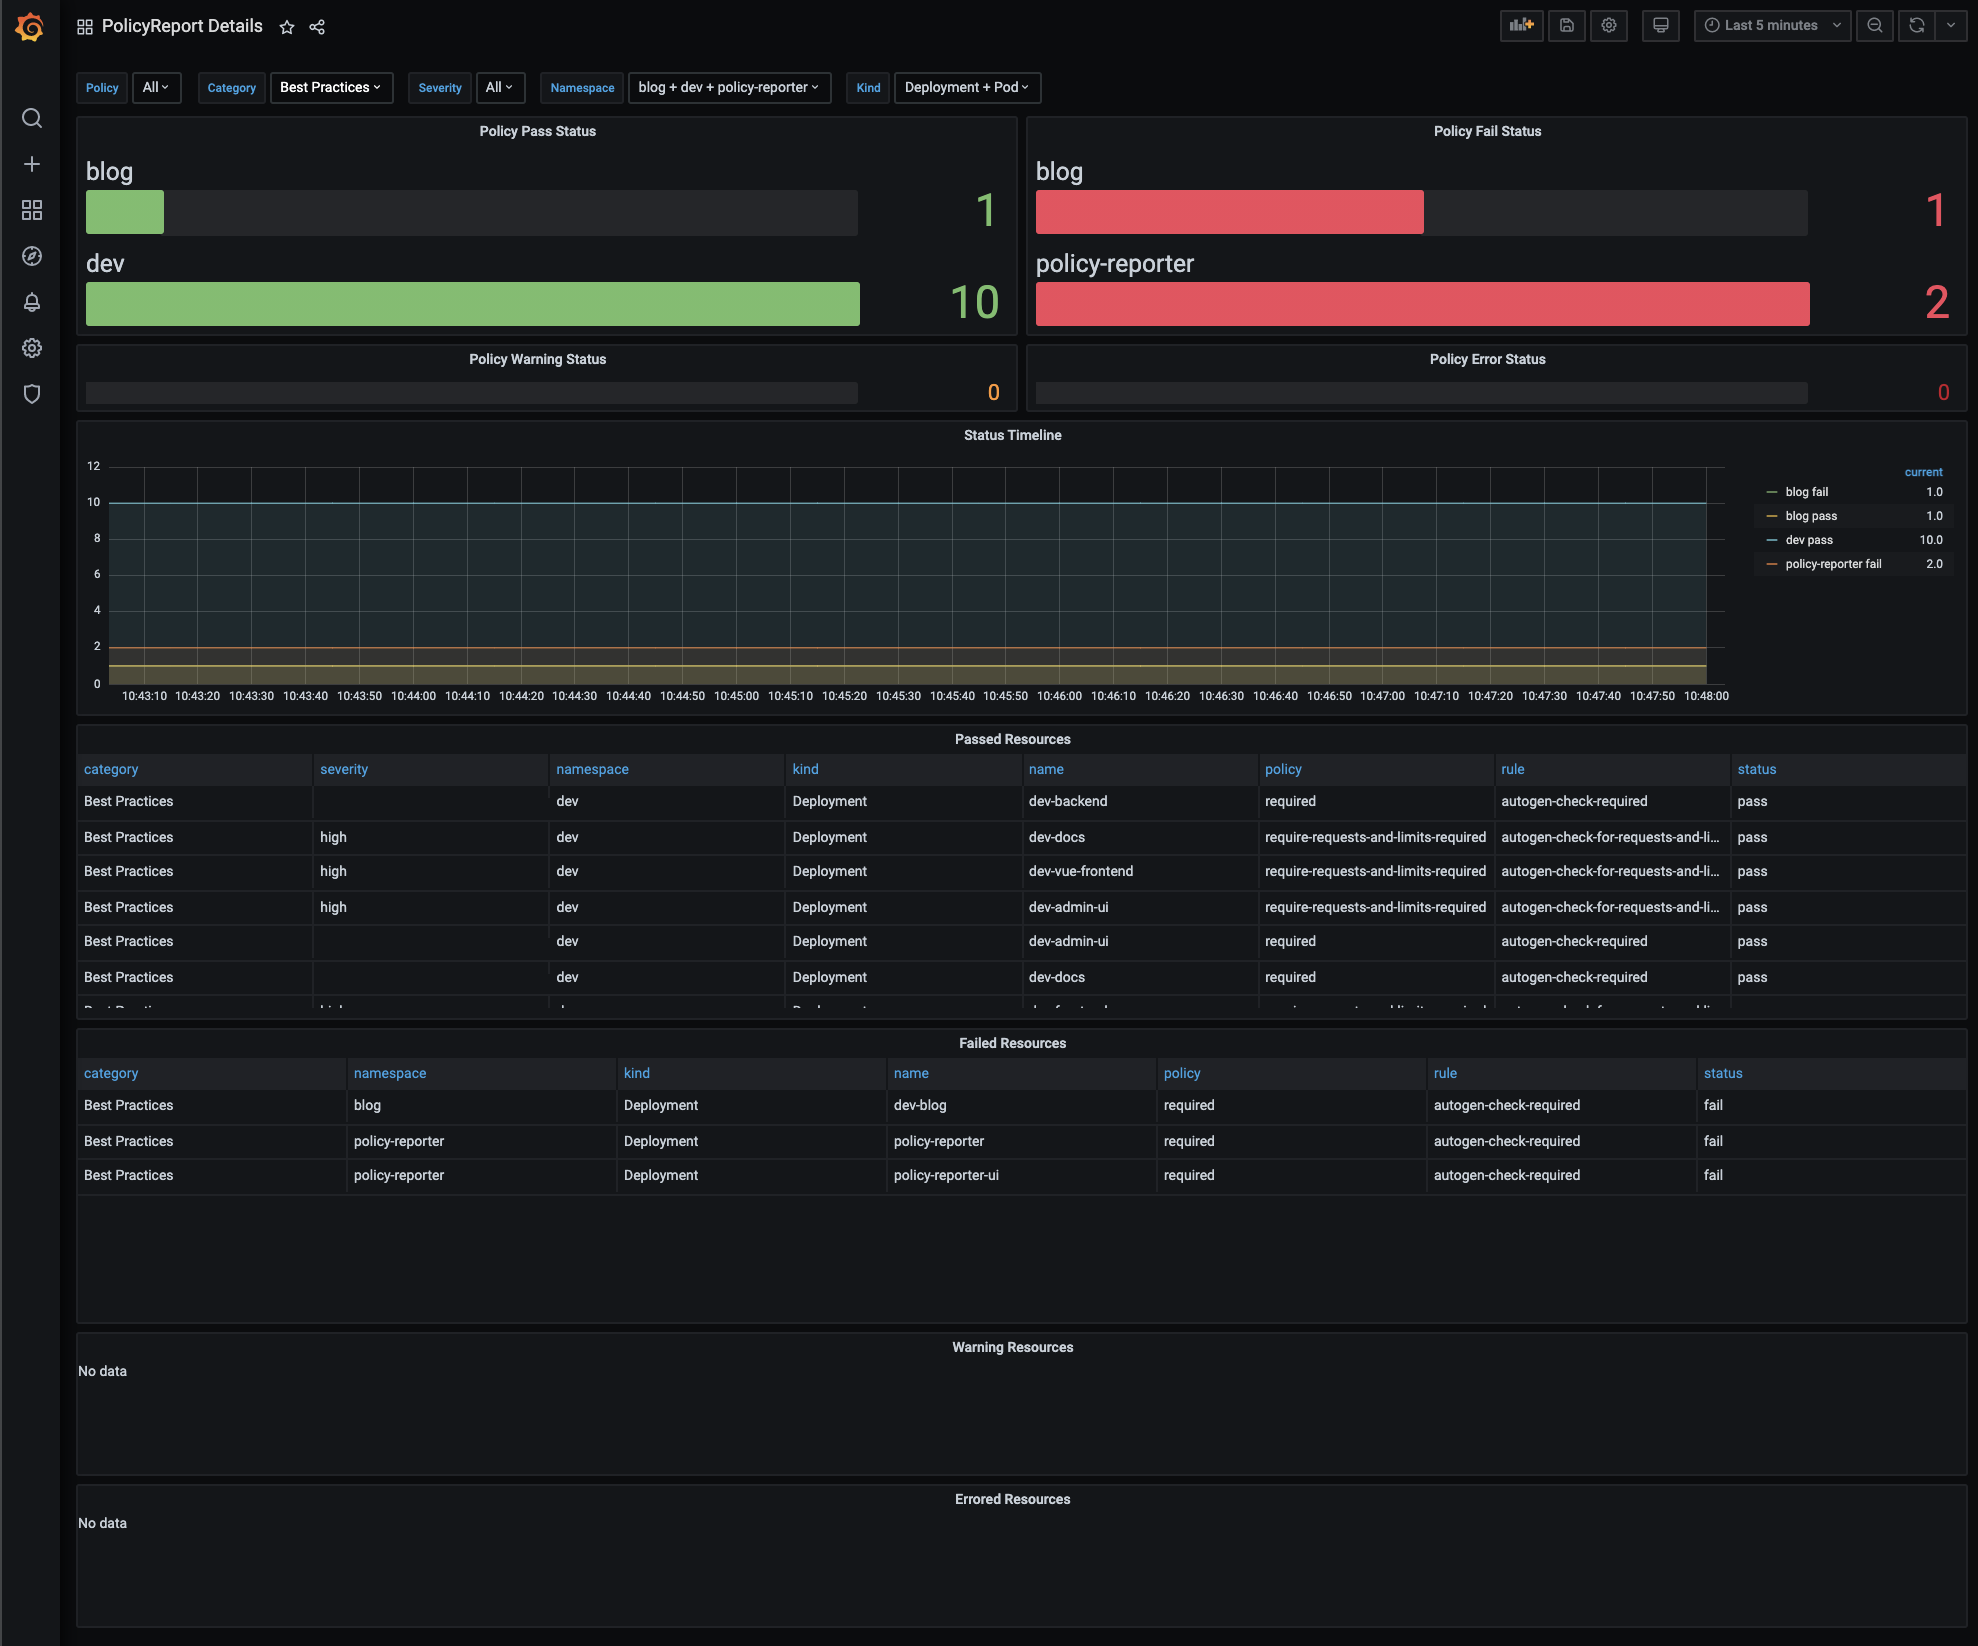
Policy Reporter provides also a Prometheus Metrics API as well as an standalone mode along with the Policy Reporter UI.
This project is in an early stage. Please let me know if anything did not work as expected or if you want to send your audits to unsupported targets.
Documentation
You can find detailed Information about Features and Configurations in the Documentation.
Getting Started
Installation with Helm v3
Installation via Helm Repository
Add the Helm repository
helm repo add policy-reporter https://fjogeleit.github.io/policy-reporter
helm repo update
Basic Installation - Provides Prometheus Metrics
helm install policy-reporter policy-reporter/policy-reporter -n policy-reporter --create-namespace
Example
Policy Reporter UI
You can use the Policy Reporter as standalone Application along with the Policy Reporter UI.
The UI is provided as optional Helm Sub Chart and can be enabled by setting ui.enabled to true.
Installation
helm install policy-reporter policy-reporter/policy-reporter --set ui.enabled=true -n policy-reporter --create-namespace
Access it with Port Forward on localhost
kubectl port-forward service/policy-reporter-ui 8082:8080 -n policy-reporter
Open http://localhost:8082/ in your browser.
Example
The UI is an optional application and provides three different views with informations about the validation status of your audit policies.


Targets
Policy Reporter supports the following Targets to send new (Cluster)PolicyReport Results too:
Use the documentation for details about the usage and configuration of each target.
Screenshots
Loki

Elasticsearch

Slack

Discord

MS Teams

Monitoring
The Helm Chart includes optional Sub Chart for Prometheus Operator Integration. The provided Dashboards working without Loki and are only based on the Prometheus Metrics.
Have a look into the Documentation for details.
Grafana Dashboard Import
If you are not using the MonitoringStack you can import the dashboards from Grafana


