|
|
||
|---|---|---|
| .github | ||
| charts/policy-reporter | ||
| cmd | ||
| docs/images | ||
| pkg | ||
| .dockerignore | ||
| .gitignore | ||
| CHANGELOG.md | ||
| Dockerfile | ||
| go.mod | ||
| go.sum | ||
| LICENSE.md | ||
| main.go | ||
| Makefile | ||
| README.md | ||
PolicyReporter
Motivation
Kyverno ships with two types of validation. You can either enforce a rule or audit it. If you don't want to block developers or if you want to try out a new rule, you can use the audit functionality. The audit configuration creates PolicyReports which you can access with kubectl. Because I can't find a simple solution to get a general overview of this PolicyReports and PolicyReportResults, I created this tool to send information from PolicyReports to different targets like Grafana Loki, Elasticsearch or Slack. This tool provides by default an HTTP server with Prometheus Metrics on http://localhost:2112/metrics about ReportPolicy Summaries and ReportPolicyRules.
This project is in an early stage. Please let me know if anything did not work as expected or if you want to send your audits to other targets then Loki.
Getting Started
Installation with Helm v3
Installation via Helm Repository
Add the Helm repository
helm repo add policy-reporter https://fjogeleit.github.io/policy-reporter
helm repo update
Basic Installation - Provides Prometheus Metrics
helm install policy-reporter policy-reporter/policy-reporter -n policy-reporter --create-namespace
Example
Installation with Loki
helm install policy-reporter policy-reporter/policy-reporter --set target.loki.host=http://loki:3100 -n policy-reporter --create-namespace
Additional configurations for Loki
- Configure
target.loki.minimumPriorityto send only results with the configured minimumPriority or above, empty means all results. (info < warning < error) - Configure
target.loki.skipExistingOnStartupto skip all results who already existed before the PolicyReporter started (default:true).
target:
  loki:
    host: ""
    minimumPriority: ""
    skipExistingOnStartup: true
Example
Installation with Elasticsearch
helm install policy-reporter policy-reporter/policy-reporter --set target.elasticsearch.host=http://elasticsearch:3100 -n policy-reporter --create-namespace
Additional configurations for Elasticsearch
- Configure
target.elasticsearch.indexto customize the elasticsearch index. - Configure
target.elasticsearch.rotationis added as suffix to the index. Possible values aredaily,monthly,annuallyandnone. - Configure
target.elasticsearch.minimumPriorityto send only results with the configured minimumPriority or above, empty means all results. (info < warning < error) - Configure
target.elasticsearch.skipExistingOnStartupto skip all results who already existed before the PolicyReporter started (default:true).
target:
  elasticsearch:
    host: ""
    index: "policy-reporter"
    rotation: "daily"
    minimumPriority: ""
    skipExistingOnStartup: true
Example
Installation with Slack
helm install policy-reporter policy-reporter/policy-reporter --set target.slack.webhook=http://hook.slack -n policy-reporter --create-namespace
Additional configurations for Slack
- Configure
target.slack.minimumPriorityto send only results with the configured minimumPriority or above, empty means all results. (info < warning < error) - Configure
target.slack.skipExistingOnStartupto skip all results who already existed before the PolicyReporter started (default:true).
target:
  slack:
    webhook: ""
    minimumPriority: ""
    skipExistingOnStartup: true
Example
Installation with Discord
helm install policy-reporter policy-reporter/policy-reporter --set target.discord.webhook=http://hook.discord -n policy-reporter --create-namespace
Additional configurations for Discord
- Configure
target.discord.minimumPriorityto send only results with the configured minimumPriority or above, empty means all results. (info < warning < error) - Configure
target.discord.skipExistingOnStartupto skip all results who already existed before the PolicyReporter started (default:true).
target:
  discord:
    webhook: ""
    minimumPriority: ""
    skipExistingOnStartup: true
Example
Customization
You can combine multiple targets by setting the required host or webhook configuration for your targets of choice. For all possible configurations checkout the ./charts/policy-reporter/values.yaml to change any available configuration.
Configure Policy Priorities
By default kyverno PolicyReports has no priority or severity for policies. So every passed rule validation will be processed as notice, a failed validation is processed as error. To customize this you can configure a mapping from policies to fail priorities. So you can send them as debug, info or warnings instead of errors.
A special Policyname default is supported. The default configuration can be used to set a global default priority instead of error.
Configure with Helm
You can configure the Policy Priorities with Helm. Configure mapping under policyPriorities with a map of Policyname and Priority pairs, like below.
policyPriorities:
  enabled: true
  mapping:
    default: warning
    require-ns-labels: error
Self managed ConfigMap
To configure the priority ConfigMap on your own, enable the required Role and RoleBinding by setting policyPriorities.enabled to true and create a ConfigMap in your Release Namespace with the name policy-reporter-priorities. Configure each priority as value with the Policyname as key and the Priority as value. This Configuration is loaded and synchronized during runtime. Any change to this configmap will automaticly synchronized, no new deployment needed.
Enable the required Role and RoleBinding
helm install policy-reporter policy-reporter/policy-reporter --set policyPriorities.enabled=true -n policy-reporter --create-namespace
Create the ConfigMap
kubectl create configmap policy-reporter-priorities --from-literal check-label-app=warning --from-literal require-ns-labels=warning -n policy-reporter
apiVersion: v1
kind: ConfigMap
metadata:
  name: policy-reporter-priorities
  namespace: policy-reporter
data:
  default: debug
  check-label-app: warning
  require-ns-labels: warning
Monitoring
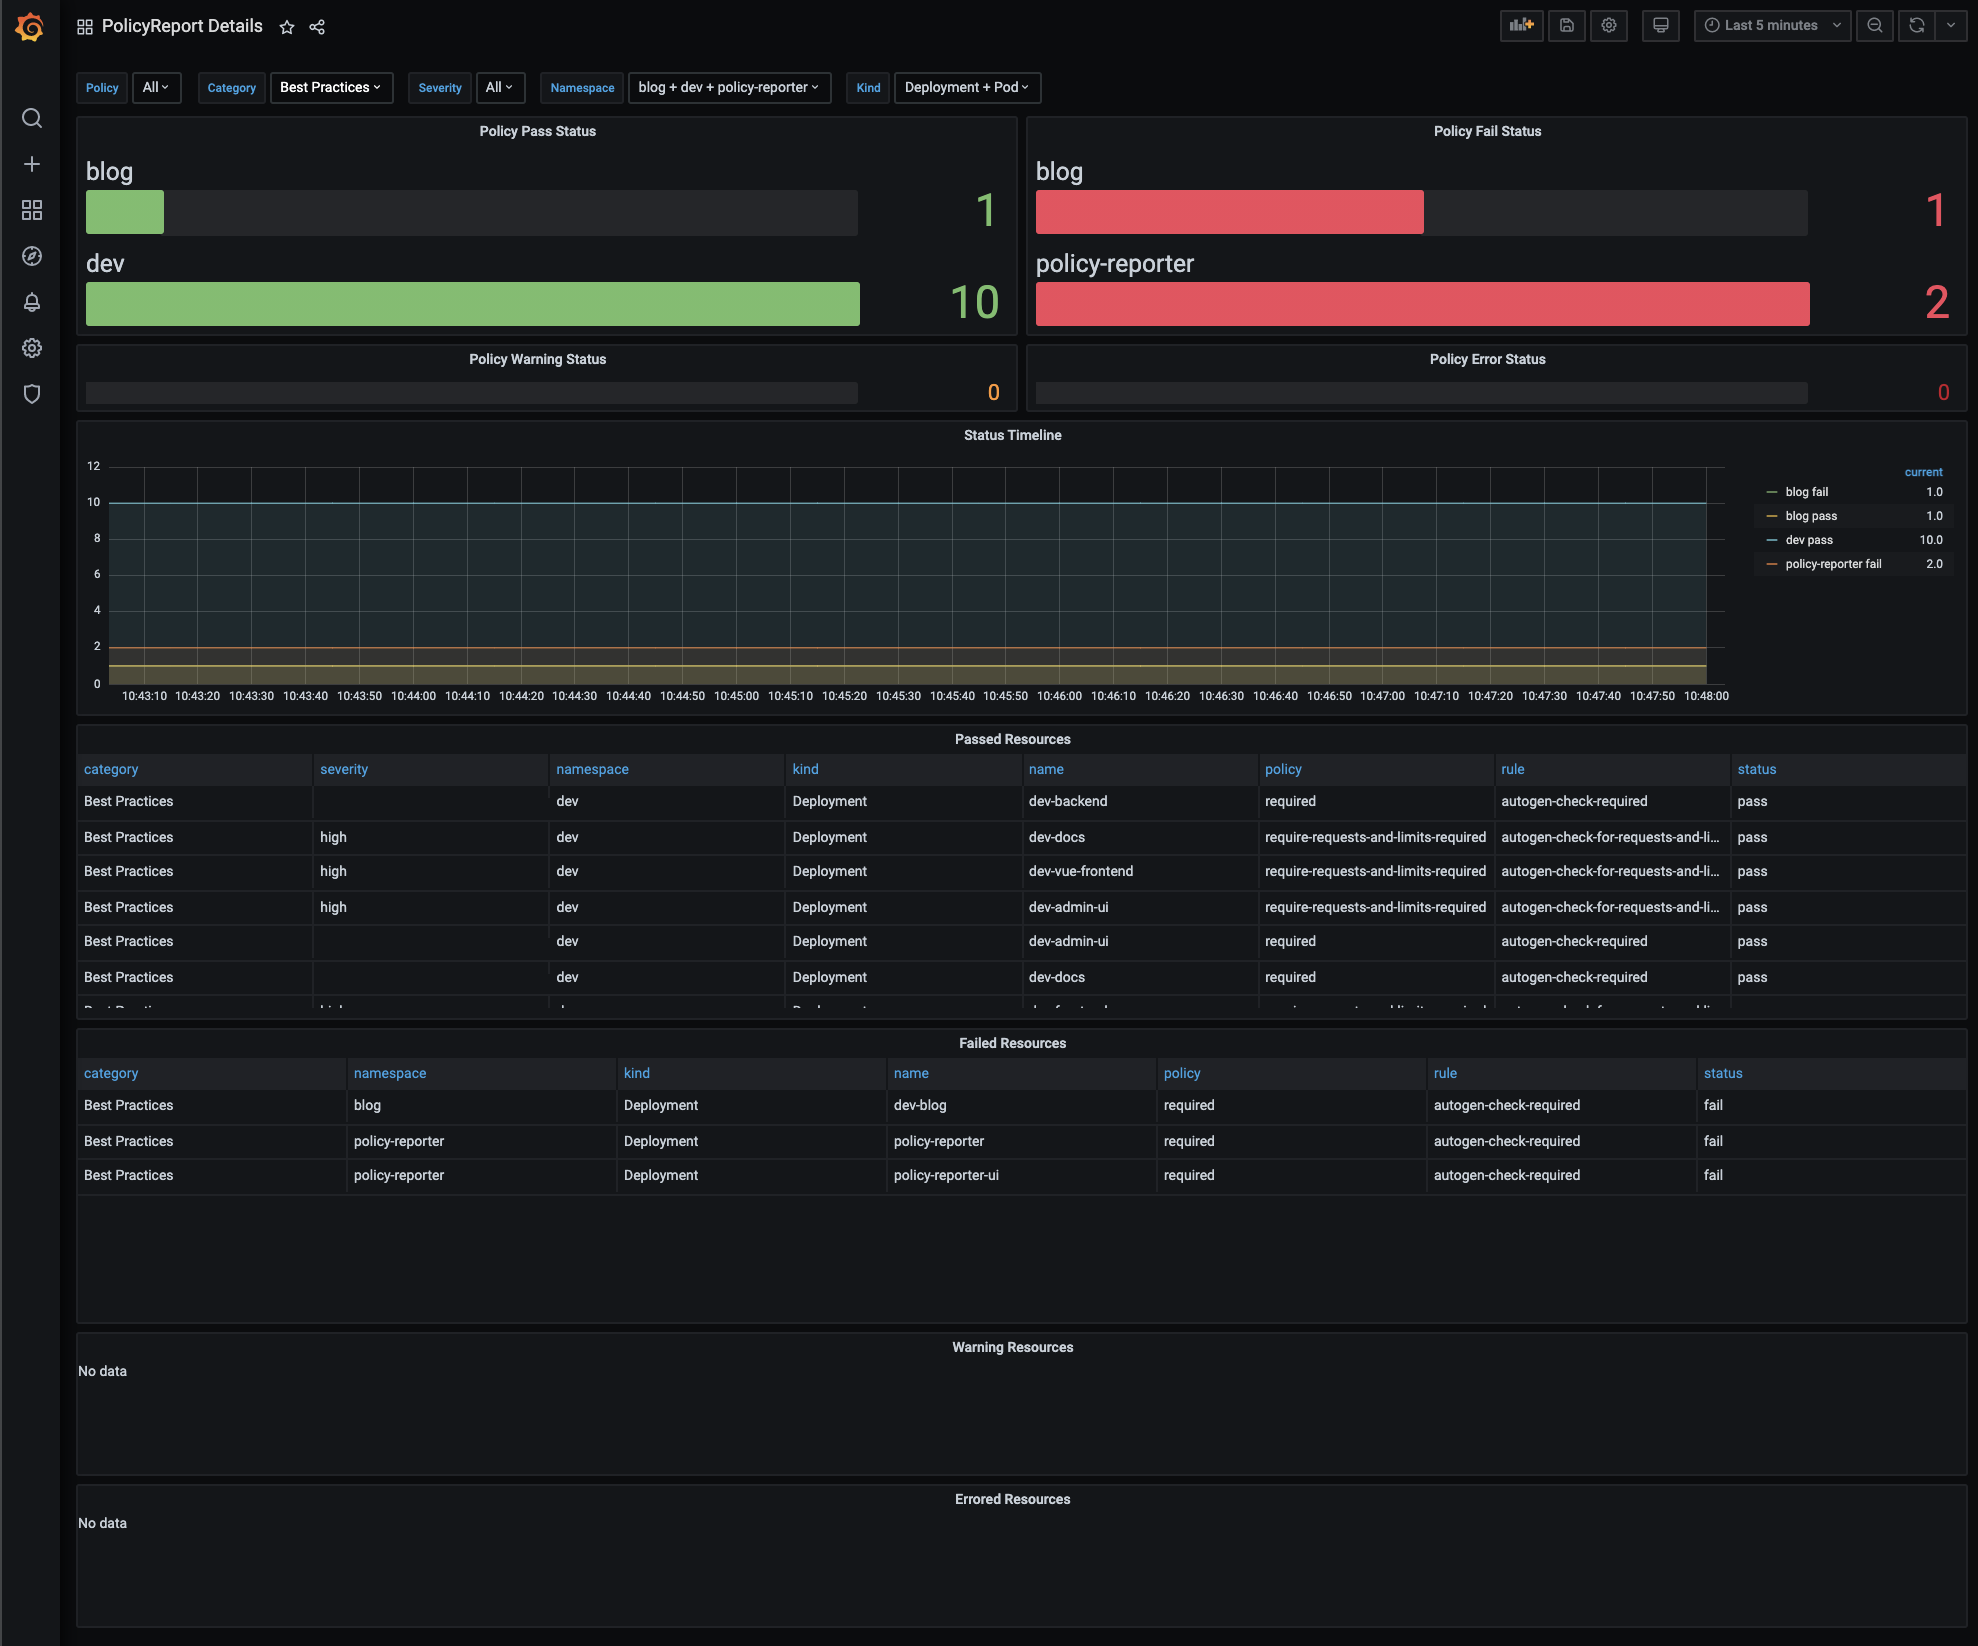
The Helm Chart includes optional Sub Chart for the MonitoringStack. The provided Dashboards working without Loki and are only based on the Prometheus Metrics.
- Enable the Monitoring by setting
monitoring.enabledtotrue.- Change the
namespaceto your required monitoring namespace by changingmonitoring.namespace(default:cattle-dashboards) - With
monitoring.serviceMonitor.labelsyou can add additional labels to theServiceMonitor. This helps to match theserviceMonitorSelectorconfiguration of your Prometheus resource
- Change the
Example Installation
helm install policy-reporter policy-reporter/policy-reporter --set monitoring.enabled=true --set monitoring.namespace=cattle-dashboards -n policy-reporter --create-namespace
Customized Dashboards
The Monitoring Subchart offers several values for changing the height or disabling different components of the individual dashboards.
To change a value of this subchart you have to prefix each option with monitoring.
Example
helm install policy-reporter policy-reporter/policy-reporter --set monitoring.enabled=true --set monitoring.policyReportDetails.secondStatusRow.enabled=false -n policy-reporter --create-namespace
PolicyReport Details Dashboard
| Value | Default |
|---|---|
| policyReportDetails.firstStatusRow.height | 6 |
| policyReportDetails.secondStatusRow.enabled | true |
| policyReportDetails.secondStatusRow.height | 2 |
| policyReportDetails.statusTimeline.enabled | true |
| policyReportDetails.statusTimeline.height | 8 |
| policyReportDetails.passTable.enabled | true |
| policyReportDetails.passTable.height | 8 |
| policyReportDetails.failTable.enabled | true |
| policyReportDetails.failTable.height | 8 |
| policyReportDetails.warningTable.enabled | true |
| policyReportDetails.warningTable.height | 4 |
| policyReportDetails.errorTable.enabled | true |
| policyReportDetails.errorTable.height | 4 |
ClusterPolicyReport Details Dashboard
| Value | Default |
|---|---|
| clusterPolicyReportDetails.statusRow.height | 6 |
| clusterPolicyReportDetails.statusTimeline.enabled | true |
| clusterPolicyReportDetails.statusTimeline.height | 8 |
| clusterPolicyReportDetails.passTable.enabled | true |
| clusterPolicyReportDetails.passTable.height | 8 |
| clusterPolicyReportDetails.failTable.enabled | true |
| clusterPolicyReportDetails.failTable.height | 8 |
| clusterPolicyReportDetails.warningTable.enabled | true |
| clusterPolicyReportDetails.warningTable.height | 4 |
| clusterPolicyReportDetails.errorTable.enabled | true |
| clusterPolicyReportDetails.errorTable.height | 4 |
PolicyReport Overview Dashboard
| Value | Default |
|---|---|
| policyReportOverview.failingSummaryRow.height | 8 |
| policyReportOverview.failingTimeline.height | 10 |
| policyReportOverview.failingPolicyRuleTable.height | 10 |
| policyReportOverview.failingClusterPolicyRuleTable.height | 10 |
Grafana Dashboard Import
If you are not using the MonitoringStack you can import the dashboards from Grafana
Dashboard Preview
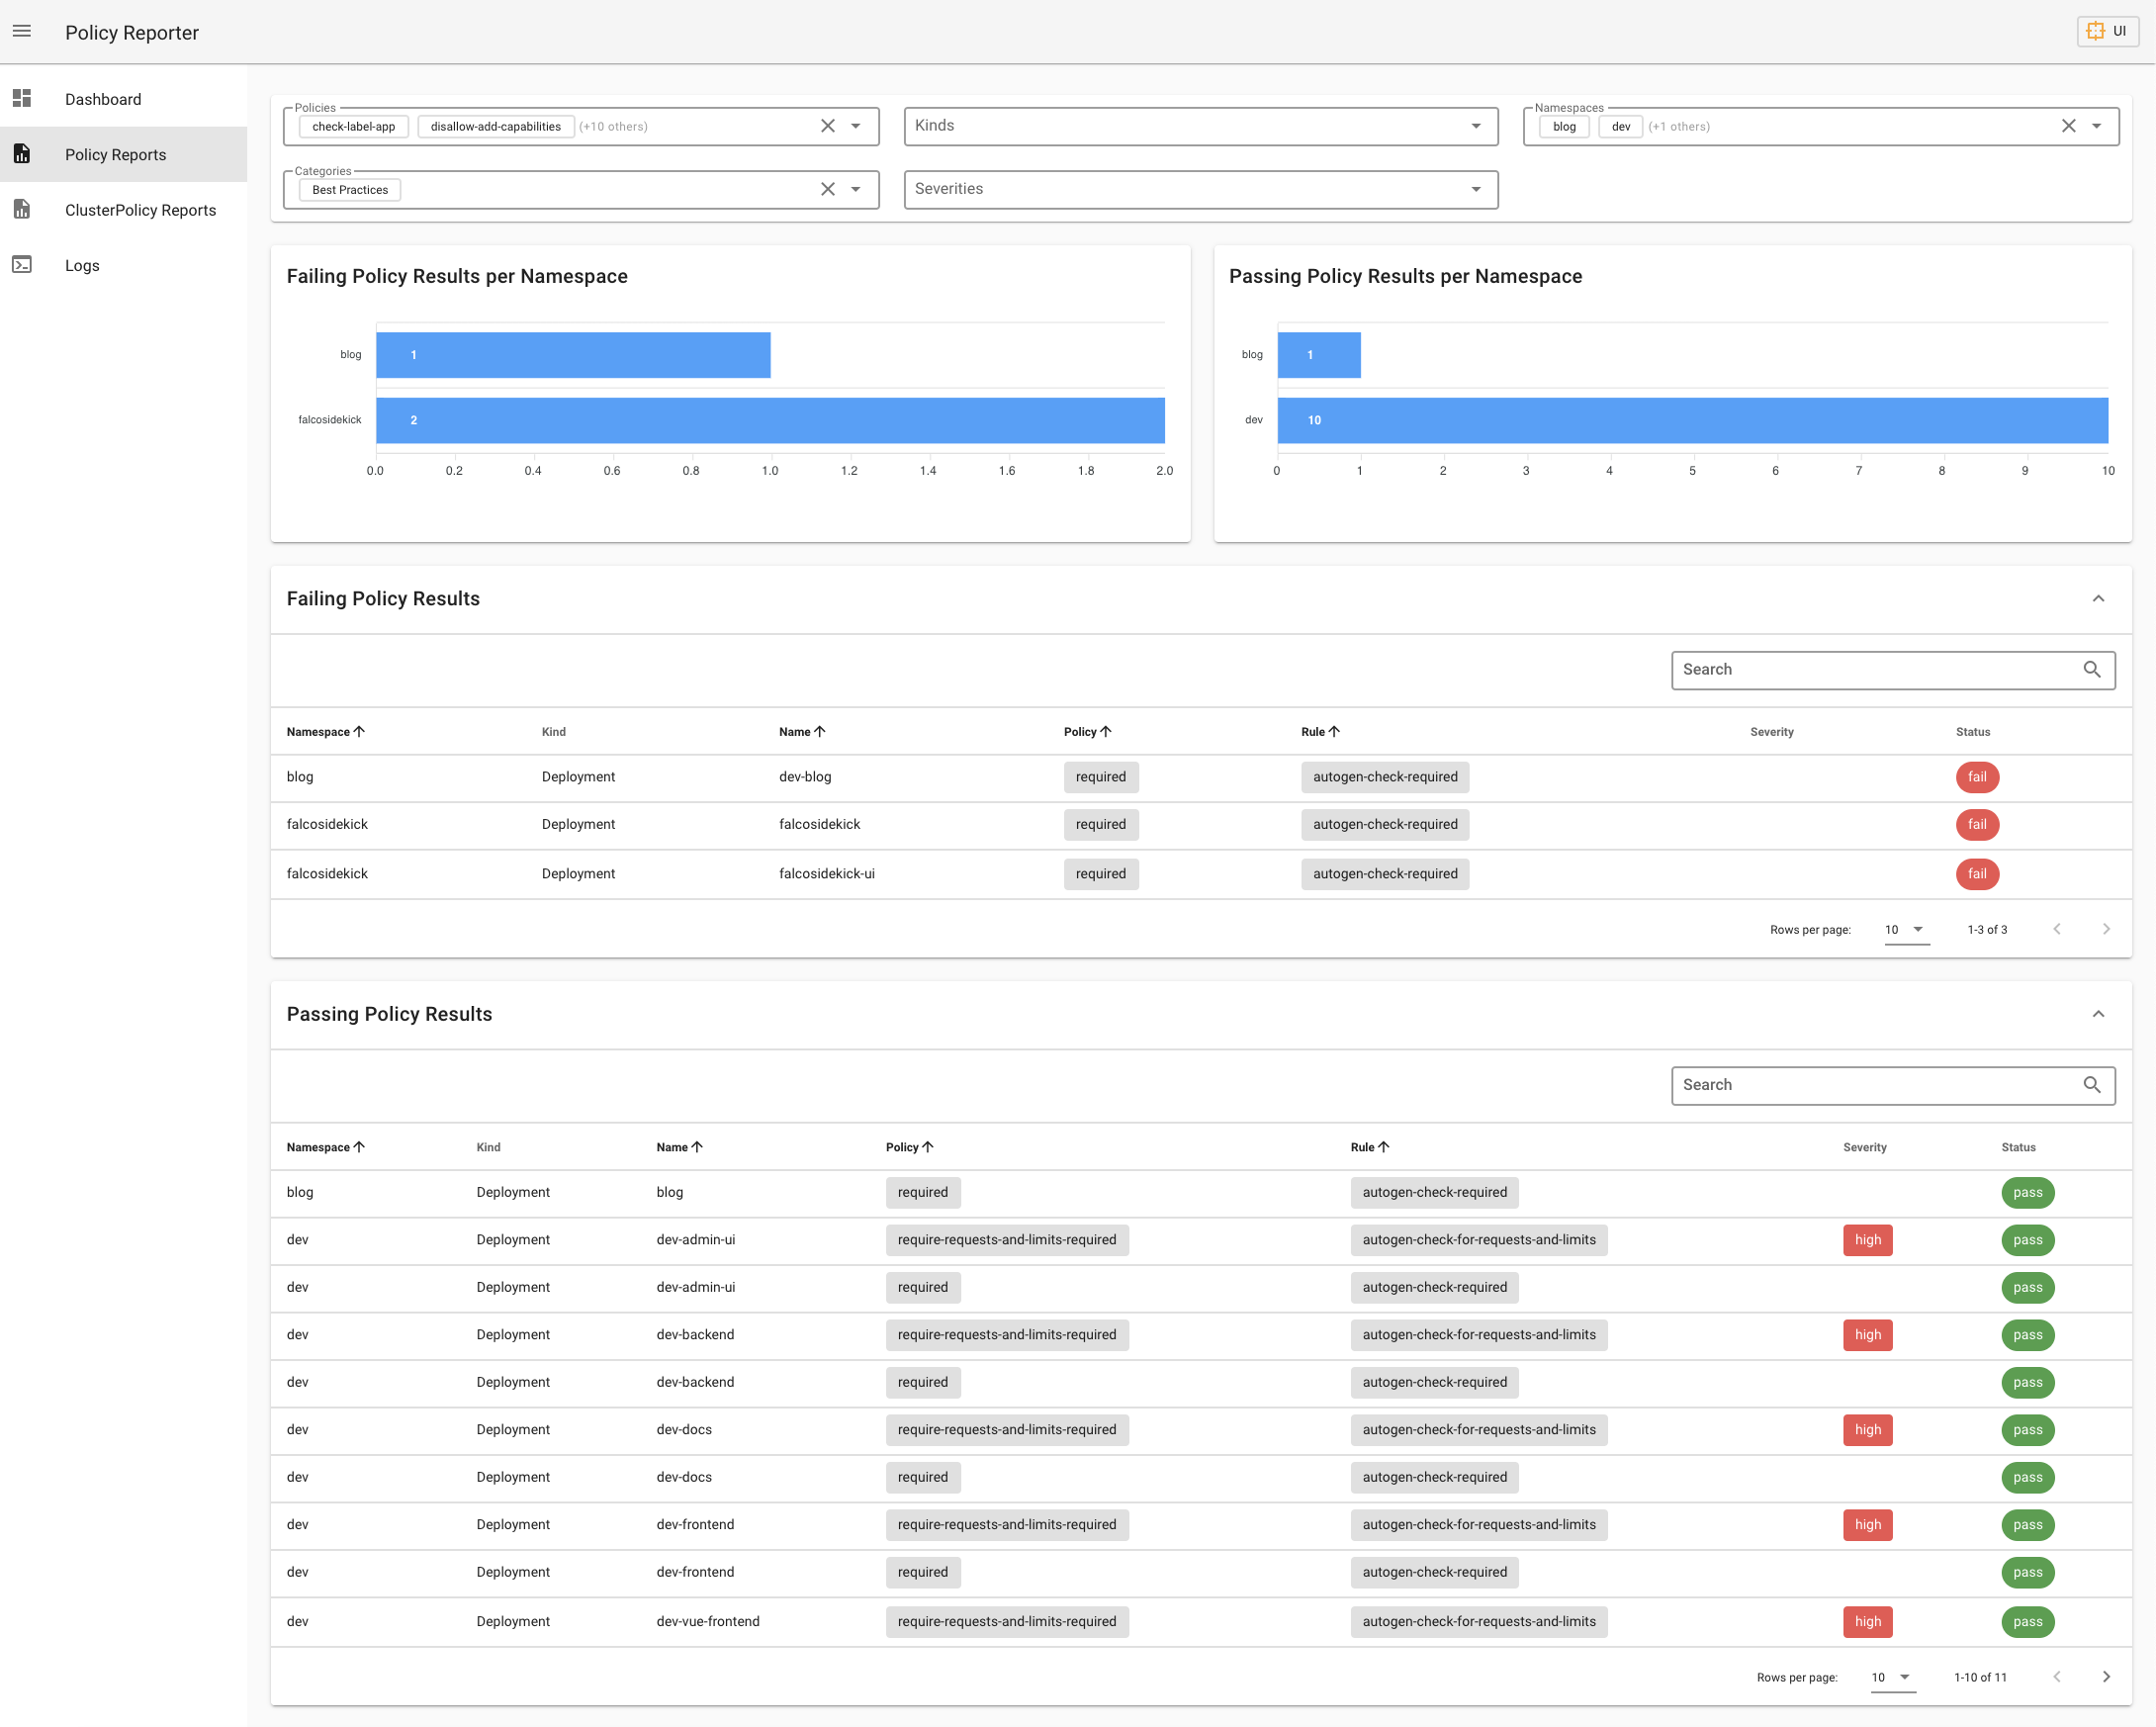
Policy Report UI
If you don't have any supported Monitoring solution running, you can use the standalone Policy Report UI.
The UI is provided as optional Helm Sub Chart and can be enabled by setting ui.enabled to true.
Installation
helm install policy-reporter policy-reporter/policy-reporter --set ui.enabled=true -n policy-reporter --create-namespace
Access it with Port Forward on localhost
kubectl port-forward service/policy-reporter-ui 8082:8080 -n policy-reporter
Open http://localhost:8082/ in your browser.
Example
The UI is an optional application and provides three different views with informations about the validation status of your audit policies.
Example Helm values.yaml
Example Helm values.yaml with the integrated Policy Reporter UI, Loki as target and customized Grafana Dashboards enabled.
ui:
  enabled: true

policyPriorities:
  enabled: true
  mapping:
    default: warning
    require-ns-labels: error

target:
  loki:
    host: "http://loki.loki-stack.svc.cluster.local:3100"
    minimumPriority: "warning"
    skipExistingOnStartup: true

monitoring:
  enabled: true

  policyReportDetails:
    firstStatusRow:
      height: 6
    secondStatusRow:
      enabled: false
      height: 2
    statusTimeline:
      enabled: true
      height: 8
    passTable:
      enabled: true
      height: 8
    failTable:
      enabled: true
      height: 8
    warningTable:
      enabled: false
      height: 4
    errorTable:
      enabled: false
      height: 4

  clusterPolicyReportDetails:
    statusRow:
      height: 6
    statusTimeline:
      enabled: true
      height: 8
    passTable:
      enabled: true
      height: 8
    failTable:
      enabled: true
      height: 8
    warningTable:
      enabled: false
      height: 4
    errorTable:
      enabled: false
      height: 4

  policyReportOverview:
    failingSummaryRow:
      height: 8
    failingTimeline:
      height: 10
    failingPolicyRuleTable:
      height: 10
    failingClusterPolicyRuleTable:
      height: 10
Todos
Support for ClusterPolicyReportsAdditional Targets- Filter


